Modernization
Future-proof your business with modernization strategies and solutions.

Proactive modernization is key to boosting efficiency, cutting costs, and enhancing service delivery in today's competitive digital landscape.
Specializing in upgrading and future-proofing systems, we use state-of-the-art technology and industry insights to turn legacy infrastructures into agile, robust platforms. With tailored strategies and AI-driven accelerators, we help you address specific challenges, secure a competitive edge, and transform your business with forward-thinking modernization.
100%
successful re-platforming across all major hyperscalers
~45%
improvement in application performance post-modernization
40%
average reduction in total cost of ownership post-modernization
Services
Consulting & Experience
- Cloud Migration Strategy
- Application Modernization
- Hybrid Cloud Strategy
- Governance & Optimization
- Agile Coaching
Software Engineering
- Cloud Migration
- Infrastructure Services
- DevOps & DevSecOps
- Managed Cloud Services
- Cyber Security
Quality Engineering
- Performance Testing
- Integration Testing
- Security Testing
- A/B Testing
- Drive Testing
Tools & Technologies
Accelerators
Enablers for Enhanced Efficiency and Faster Go-to-Market
Cloud Migration and Optimization Enabler
Streamline the migration of legacy applications to the cloud while optimizing for performance and cost through automated tools.
Infrastructure as Code (IaC) Scaling Module
Manage infrastructure with code by automating resource provisioning and scaling across cloud environments using Terraform.
App Modernization Transformer
Automate the modernization of legacy applications with AI-driven refactoring tools, ensuring applications are cloud-ready and scalable.
Hybrid Cloud Orchestration Toolkit
Leverage tools that enable the seamless orchestration and integration between on-prem, private and public cloud resources to optimize performance and cost.
API Management and Automation Enabler
Centralize API management with API gateway and other tools that secure and streamline interactions across systems, supporting agility and scalability in modern applications.
IoT Testing Framework
Faster carrier on-boarding, testing, validation, and seamless system integration for precise IoT device deployment.
Ready to modernize? Transform your technology today.
Utilized test automation to improve eCommerce platform performance and reduce errors before release.
Delivered an integrated solution ensuring seamless end-to-end experience with system integration (SI) testing.
Automated large-scale testing to improve product quality for a global manufacturer.
Insights

Transform your legacy code effortlessly with RefactorX – a Generative AI-powered Code Converter.Our solution, RefactorX, converts any legacy code to your desired code, including version upgrades (like JavaScript to NodeJS). With RefactorX, you can also create technical and business level documentation regarding legacy or transformed code with an excellent search facility through existing documents and knowledge base.Innovative Use of Generative AI Utilizes advanced AI models to automate the transformation of legacy code into modern languages or updated versions.Comprehensive Transformation Suite Offers code translation, optimization, documentation generation, AI-enabled unit testing, and a knowledge management system.Targeted Solution Approach Designed to address the specific needs of industries heavily reliant on legacy systems, such as Telco, Banking, and Retail.Optimization Improves code quality and maintainability without changing its external behavior and business logic.With RefactorX 59% Increased Agility 57% Reduced Maintenance Costs 70% Better Integration with Other Platforms Watch now for a live RefactorX demo showcasing its GenAI-based approach to legacy modernization and experience efficient, error-free, and scalable code development.
Code Conversion: Modernizing Legacy Code with GenAI

As system management becomes increasingly complex, effective monitoring tools are more important than ever.Enter Prometheus and Grafana – a dynamic duo for anyone concerned with system observability.The combination of these popular tools offer a comprehensive ecosystem for monitoring, alerting, and data visualization, providing valuable insights into the health and performance of your systems.Prometheus is an open-source monitoring and alerting system that excels at collecting and storing time-series data, while Grafana is a powerful visualization and dashboarding tool.Together, they provide a comprehensive solution for monitoring, visualizing, and alerting on the performance and health of systems and applications.This guide will walk you through the process of integrating these tools into your system management strategy, offering practical solutions to commonly faced challenges like data overload, lack of real-time visibility, and complex system diagnostics.These crowd favorites form a powerhouse that can handle monitoring, alerting, and data visualization, truly serving as a lifeline to complex system management challenges.Armed with this guide, you'll gain the ability to detect issues swiftly and respond to them effectively, thereby enhancing the overall reliability of your systems.What is Prometheus?A Go-based open source monitoring programme called Prometheus gathers metrics data and saves it in a time series database. It was created by SoundCloud at the beginning in 2012, then in 2016 it joined the Cloud Native Computing Foundation (CNCF). PromQL, a potent query language, is used to query your time series data.Prometheus is a core technology for monitoring and observability of systems, but the term “Prometheus” can be confusing because it is used in different contexts. Understanding Prometheus basics, why it’s valuable for system observability, and how users use it in practice will both help you better understand it and help you use Grafana.Features of PrometheusData Model and Query Language Time-Series Database Data Collection Service Discovery Alerting and Notification Visualization and Dashboards Scalability and Federation Reliability and High Availability Pull and Push Models How PromQL HelpsThe functional query language known as PromQL, or Prometheus Query Language, enables you to choose and aggregate time series data. With its flexibility and strength, you can manipulate your data however you see fit.For example, if you want to retrieve CPU usage metric from a target named "my_app", you would use this:cpu_usage{job="my_app"}What is Grafana?Grafana is an open-source tool for executing data analytics with the aid of metrics that, when combined with scalable dashboards, provide us an understanding of the intricate infrastructure and vast amounts of data that our services handle.Every data source imaginable, including Graphite, Prometheus, Influx DB, ElasticSearch, MySQL, PostgreSQL, etc., is connected to by Grafana.As an alternative, we may create our own custom plugins to link with any data source of our choosing thanks to the open-source nature of the solution.Technically known as time series analytics, the technology aids in the study, analysis, and monitoring of data over a period of time.By providing pertinent data, it enables us to track user behavior, application behavior, the frequency of problems occurring in production, pre-production, or any other environment, the sort of faults occurring, and contextual settings.Features of GrafanaDashboard Templating Provisioning Annotations Kiosk mode and playlists Custom plugins Alerting and alert hooks Permissions and multiple teams SQL Databases Monitoring your monitoring AuthenticationUnderstanding the Grafana DashboardThe dashboards draw their information from connected data sources like Graphite, Prometheus, Influx DB, ElasticSearch, MySQL, PostgreSQL, etc. These are just a few of the numerous data sources that Grafana by default supports.The dashboards have a wide range of visualization options, including the many charts and graphs and geo maps, heat maps, histograms, and other visualizations that a business generally needs to analyze data.On the grid of the dashboard, there are numerous separate individual panels. There are many functionalities for each panel.Getting started with Prometheus and GrafanaAfter installing Prometheus and Grafana, you need to set Prometheus as the data source in Grafana and you can do that using the following steps:Click on the Grafana logo to open the sidebar. Click on “Data Sources” in the sidebar. Choose “Add New”. Select “Prometheus” as the data source. Set the Prometheus server URL Click “Add” to test the connection and to save the new data source. Why use Prometheus and Grafana?There are many reasons why the combination of Prometheus and Grafana can prove to be very powerful when integrated correctly into your systems.For starters, you have control over the metrics you want to report, their origin, and their destination when Prometheus and Grafana Agent are used together.Once the data is in Grafana, a Grafana Mimir database can be used to store it. The combination allows you to monitor and visualize the health and performance of your systems comprehensively, making it easier to detect issues and respond to them effectively.TakeawayOverall, Prometheus and Grafana are popular tools that provide a robust ecosystem for monitoring, alerting, and visualization, making them valuable assets in maintaining the reliability of your systems.The additional functionality of PromQL further enhances the value delivered by this combination, offering granular control over metrics and data.With the ability to accurately monitor health and performance, respond to issues effectively, and visualize data in an intuitive manner, these tools become instrumental in ensuring system reliability.Their power rests in their flexibility, scalability, and the profound insights they provide, making them a game-changer in the landscape of system administration and data analysis.
Mastering System Monitoring with Prometheus and Grafana: Your Handy Guide

In today's cloud-centric world, managing infrastructure has become increasingly complex.As organizations strive for scalable, flexible, and cost-effective solutions, cloud providers like Amazon Web Services (AWS) have gained immense popularity.However, setting up and managing AWS resources can be daunting — this is where Terraform, an open-source infrastructure as code (IaC) tool, comes into play.Why Use Terraform on AWS?Terraform enables you to define and provision infrastructure resources across multiple cloud providers, including AWS, in a declarative and consistent manner. By treating your infrastructure as code, you can automate the creation, modification, and destruction of resources.In this blog, we won’t just understand the power of Terraform; in fact, we will go through an in-depth exploration of Terraform integration with AWS, providing you with a comprehensive guide to creating and managing your AWS infrastructure using Terraform.Whether you are new to Terraform or an experienced user, this blog will equip you with the knowledge and practical examples needed to accelerate your infrastructure provisioning and management processes.How Does Terraform Integrate with AWS?Terraform, developed by HashiCorp, stands at the forefront of infrastructure as code tools, revolutionizing the way organizations provision and manage their infrastructure resources.With Terraform, infrastructure configurations are defined declaratively, enabling teams to treat infrastructure as code and apply software engineering practices to their infrastructure management.This powerful tool offers multi-cloud support, allowing users to provision and manage resources across various cloud providers, and provides a unified workflow for infrastructure automation and scalability.With Terraform, organizations can achieve consistent, reproducible, and efficient infrastructure management, simplifying the process of building and scaling modern cloud architectures.Getting Started with AWSCreate an AWS Account:Visit the AWS website (https://aws.amazon.com/) and click on the "Create an AWS Account" button. Follow the instructions to set up your account by providing necessary information such as your email address, payment details, and contact information. Install AWS CLI:Visit the official AWS CLI installation documentation (https://docs.aws.amazon.com/cli/latest/userguide/getting-started-install.html) to find instructions specific to your operating system. AWS CLI supports Windows, macOS, and Linux. Follow the installation guide to install AWS CLI on your machine. Configure AWS Credentials:To access your AWS resources, you need to configure your AWS credentials. Run the following command in the terminal or command prompt: `aws configure` You will be prompted to enter your AWS Access Key ID, Secret Access Key, default region, and output format. Obtain your AWS Access Key ID and Secret Access Key from the AWS Management Console by following the AWS documentation on accessing and managing your security credentials. How do you Create AWS Resources using Terraform?Terraform resources are created using JSON or the HashiCorp language, popularly known as HCL.Terraform's supplier is HashiCorp, and their native tongue is simple to write and read. Use the Visual Studio Code editor with Terraform plugin. It assists with input availability, autocompletion, and other things.We'll be using the HashiCorp language, which has the ".tf" extension, in this blog. To build the infrastructure, Terraform uses these files.By naming providers and resources, you define the infrastructure. We want to communicate with the providers, and on that provider, we want to build or manage resources.Provider:You list the provider block and a few arguments that are used to authenticate with the provider in the provider block.1. Create the provider.tf file:Create a new file named `provider.tf` in your Terraform project directory. Open the file in a text editor. 2. Configure the Azure Provider:Inside the `provider.tf` file, add the following code to configure the AWS provider:Resources:You describe what you wish to build in your provider in the resources blocks. Each resource block has its own set of necessary and, for the most part, recommended parameters.The fact that the parameters don't overlap between suppliers is crucial to understand.The code for AWS resources differs from the code for Azure resources as a result. Following is an example of how to create a resource in AWS using Terraform:1. Create the main.tf file:Create a new file named `main.tf` in your Terraform project directory. Open the file in a text editor. 2. Define the Azure Resource:After adding an AWS provider, add the following code to define an AWS resource in the main.tf file. For example, let's create an AWS S3 Bucket Resource:In here you can see we want to make a resource with the type “aws_s3_bucket” and with the name “example_bucket”. In the block we give the information that is needed to create such a resource.Working with TerraformTerraform has three main commands which are used to initialize, plan and apply resources.Once you have created your infrastructure according to your requirements, you will have to run these commands to create resources in Azure.These commands are called:Terraform init Terraform plan Terraform apply Terraform Init:Initializes a Terraform project in the current directory. Downloads the necessary provider plugins and sets up the backend. This command should be run once when setting up a new Terraform project or when making changes to the provider or backend configurations. Terraform Plan:Generates an execution plan based on the current Terraform configuration and state. Shows a preview of the changes that Terraform will make to the infrastructure. Helps you identify any issues or potential problems before applying changes. Terraform Apply:Applies the changes defined in the Terraform configuration to the infrastructure. Creates, modifies, or deletes resources according to the desired state. Terraform will prompt for confirmation before making any changes. TakeawayTerraform makes it feasible to use a single Infrastructure-as-Code tool to develop, manage, and apply infrastructure across several platforms.The infrastructure layer is another area where Terraform clearly focuses.This indicates that it offers skills like the ability to display updates, manage provider development, and manage your on-premises and cloud infrastructure in a single language.
Creating and Managing Amazon Web Services (AWS) with Terraform: A Hands-on Guide

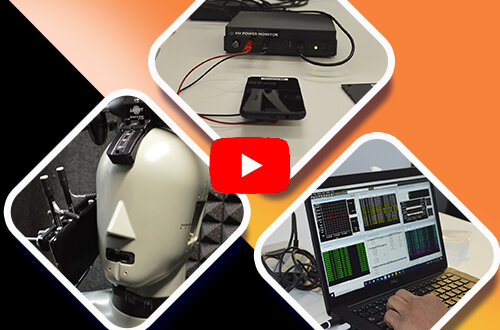
If you are looking to launch a device in Canada, whether it’s IoT, a tracker, wearable, 5G, mobile – whatever, you’re going to want to have it tested and certified first. And in this 30-minute video, you can learn how having the most common questions answered, including: Where do I start, and should I do it alone? What tools do I need, and what’s the end-to-end process? How long does it take, and what does it cost? What type of certification do I need, and what comes next? And more! The mobileLIVE Device Certification & Testing Lab professionals have been helping Fortune 500 brands and SMBs launch their products in Canada with certification, testing, and team augmentation for more than 10-years. And in this video, they will show you precisely what you need to get your device certified and launched in Canada.
How to Certify IOT, Wearables & Mobile Devices for the Canadian Market

Replace manual & scripted testing with automation Drastically reduce the cost of running multiple tests Test across multiple machines and interfaces Quickly detect system or product defects Reduce time while improving customer experience This is what the democratized future of QA and Software Testing looks with Model-Based Test Automation, and in this 30-minute video, you’ll discover not only how to accomplish the above, but why you’ll need to if you are still relying on traditional testing methods.
Model-Based Test Automation: Bigger, Better, & Faster QA

Discover HyperAutomation – the intersection of RPA, Test Automation, and AI – as we showcase how to successfully automate your E2E environment and drive ROI. This is a live recording featuring Jahan Ali, Founder and CEO of mobileLIVE, Noel Kirthiraj, CEO of UXPLORE, and Ragavan Balasubramaniam, Test Automaton Manager of mobileLIVE. It was hosted and moderated by Crina Bildea, Director of Sales.
HyperAutomation: Overcoming E2E Complexity

What does the future hold? Few know with much certainty. The only certainty of the future is it guarantees change. What won’t change, however, is our commitment to helping you succeed in that future – no matter what it brings.
Past, Present, and Future: Using Cloud, Data, Innovation, & More

No matter the industry, and whatever the vertical, Test Automation is no longer optional for excellent customer experience – it’s mandatory. Discover how with our intuitive test automation services, great experiences and reduced OPEX don’t have to be mutually exclusive.


